Do you check the weather every time you leave home? Interestingly, if you’re in the eastern parts of the world, checking the air is the norm too. Environmental pollution is real and is much more crucial than what you may have studied in high school environmental studies. It all comes down to a question of existence: would we be able to save our environment or not?
To show you a clear picture of Air Quality, we have the Air Quality Index or AQI, which is a public-health forecast for the air we breathe. It turns pollution measurements into one number and one color, so you can decide whether to jog outside, let your children play or open the windows. But who is responsible for higher AQIs? Is it the customs? Industries or ignore? Let’s find out.
What AQI Actually Measures
AQI is not the only measure of pollution, and it does not track just one pollutant. What it does here is convert the levels of several pollutants into separate scores, and they are called sub-indices. Out of these sub-indices, the worst score sets the overall AQI. So if ozone is the problem on a given day, ozone drives the number, even if everything else looks fine.
For instance, India’s National AQI includes eight pollutants: PM10, PM2.5, nitrogen dioxide, sulphur dioxide, carbon monoxide, ozone, ammonia, and lead. Their health limits are based on short-term exposure, generally upto a day, though carbon monoxide and ozone use 8-hour averages. So, out of these eight, which is mainly responsible?
The answer lies in PM2.5. It is often the biggest concern for the environment, as these particles are 2.5 micrometres or smaller, which are tiny enough to travel deep into the lungs. The World Health Organization believes that exposure to these fine particles is linked to heart disease, lung disease, and cancers. Ground-level ozone is different, as it forms when gases react in sunlight, and it is a major part of smog. So, AQI is a health-communication tool, not a full list of every contaminant.
Also read || Can Semaglutide Slow Your Cellular Aging?
How to Read the Scale
The idea of a reading scale is common in most countries, which implies that the higher the number, the greater the health risk. The U.S. EPA scale, which many apps around the world use, runs from 0 to 500 in six color-coded levels:
- 0–50, Good (Green): Little or no risk. Normal outdoor activity is fine.
- 51–100, Moderate (Yellow): Acceptable for most people, but unusually sensitive people may notice effects.
- 101–150, Unhealthy for Sensitive Groups (Orange): People with lung or heart disease, children, and older adults are more likely to be affected.
- 151–200, Unhealthy (Red): Everyone may begin to feel effects, and sensitive groups may feel more serious ones.
- 201–300, Very Unhealthy (Purple): A health alert. Everyone is more likely to be affected.
- 301–500, Hazardous (Maroon): Emergency conditions. The whole population is likely to be affected.
Some countries may use their own versions. For instance, China and India use similar 0-500 scales with six levels, but their labels and cut-off points differ. Similarly, the European Union uses six levels from Good to Extremely Poor instead of a 0–500 number. Hence, the same reading can imply different meanings in different countries.
How your body reacts to the pollution is also a factor; there are people with COPD, heart disease, lung disease or diabetes who may need to act earlier than others. Also, pregnant women, children, older adults and construction workers can face more exposure or more risk. So, never be surprised if two apps show different numbers for the same city, as they might be using different national formulas, reference standards or monitoring data.
Also read || Why Chronic Conditions Make Vaccines Urgent
Why the Air Gets Dirty
Though we all have responsibilities towards the environment, you can’t pinpoint the blame on one or two factors. Pollution comes from a mix of emissions, weather, geography and season. Here are the main sources:
- Dust: Construction, demolition, mining, and unpaved roads send dust into the air, especially in dry weather.
- Waste burning: Open burning of garbage releases particles and toxic gases.
- Household fuels: Cooking and heating with wood, charcoal, or dung add to pollution both indoors and outdoors.
- Transport: Cars, trucks, buses, and two-wheelers release nitrogen oxides, carbon monoxide, and particles. Diesel exhaust is a big contributor in many cities.
- Industry and power: Factories, power plants, and brick kilns can release particles, sulphur dioxide, and nitrogen dioxide.
- Crop burning: Burning crop residue can pour smoke and PM2.5 into the air of a whole region.
- Chemistry and weather: Some pollutants form in the air when gases react. Low wind, temperature inversions, and valley-like terrain can then trap everything close to the ground.
It might look tempting to blame one group or tradition, but the long-term pollution is caused by a larger system that includes energy, transport, industry, waste, and weather. Festivals and farming practices are part of the problem, but they only cause acute spikes which can be dangerous for some people. Hence, the better question is not “Who to blame?” but “How will cutting exposure work for everyone?”
Also read || Can Skinny People Have Too Much Visceral Fat?
Where Pollution Hits Hardest
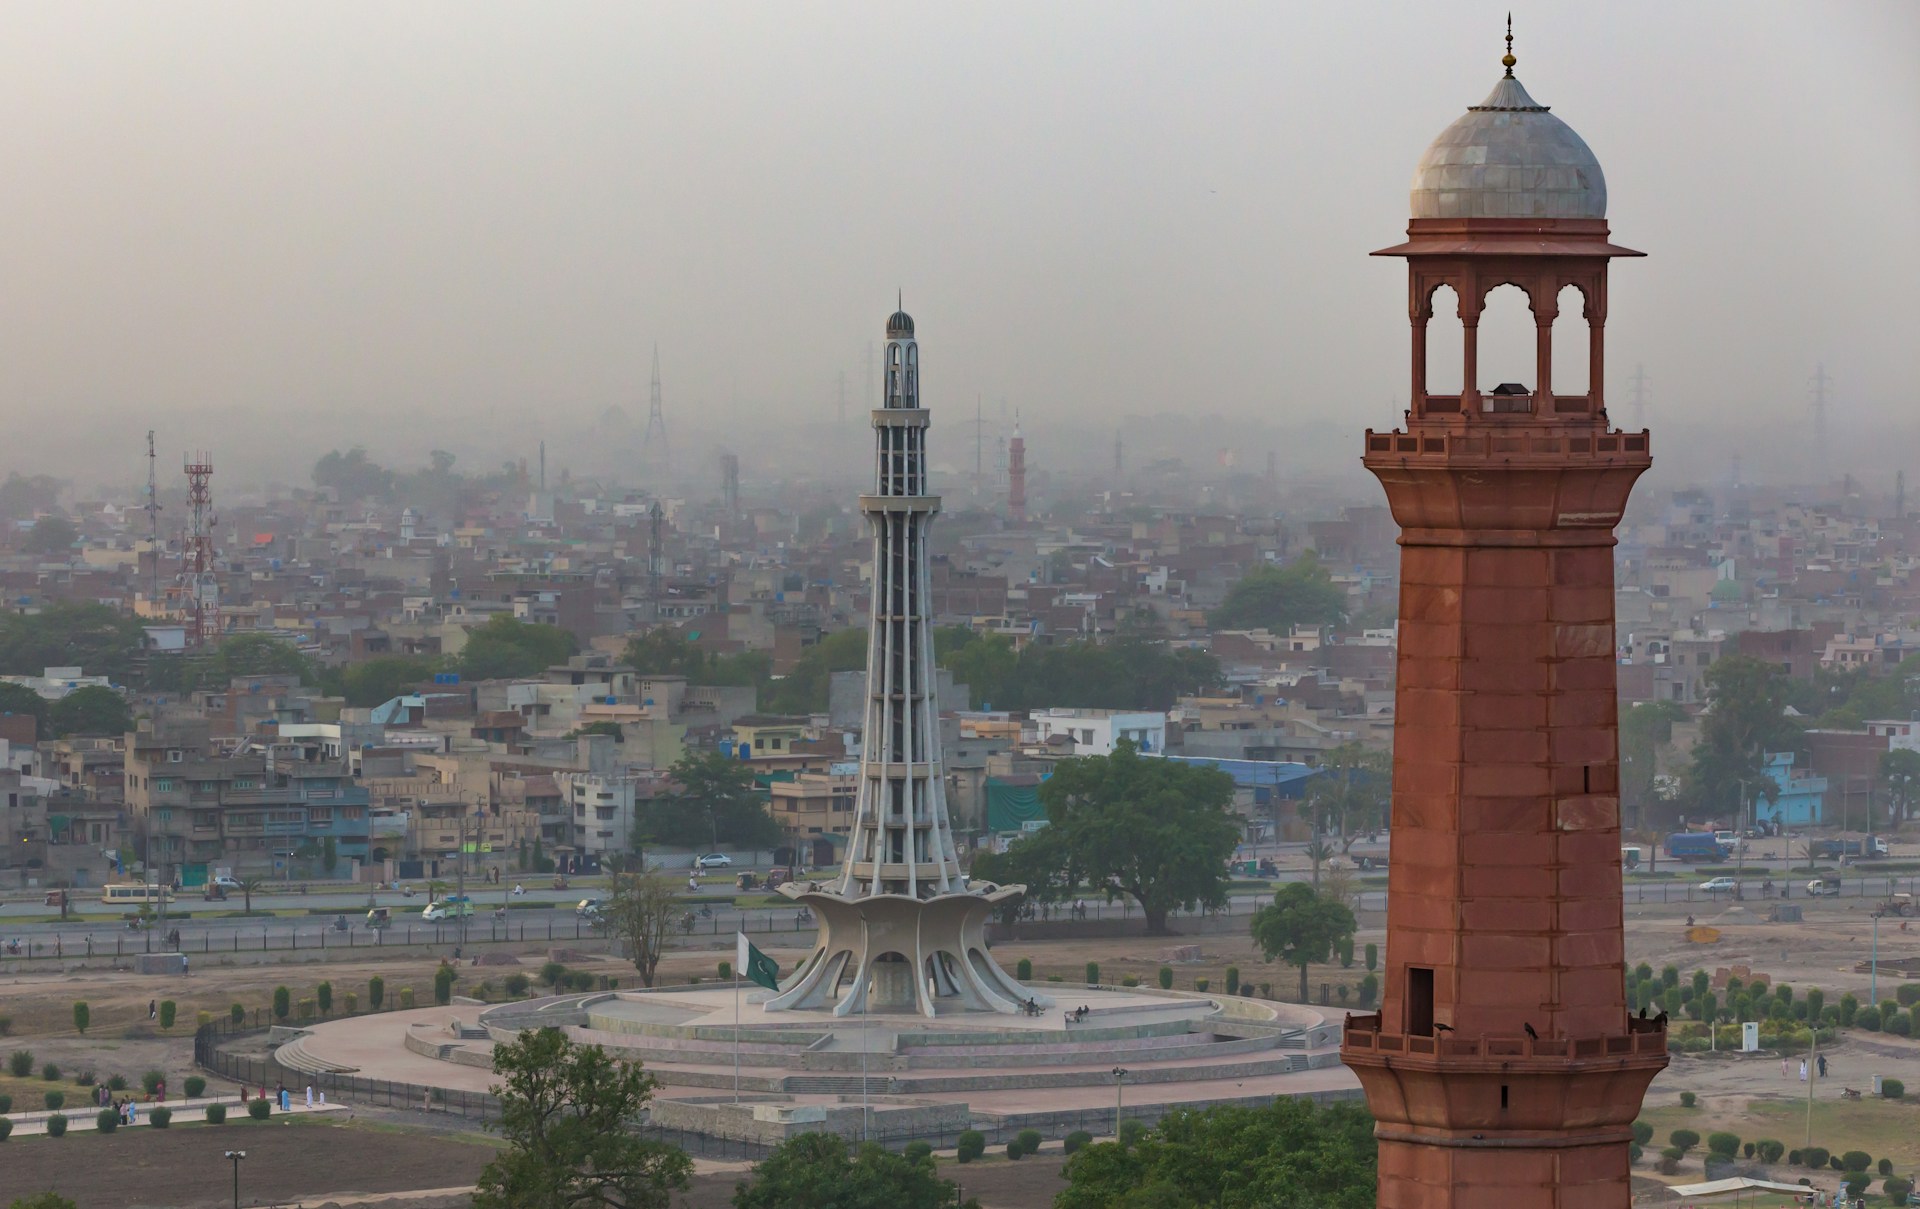
The AQI rankings fluctuate every day, but some cities keep showing up at the top, such as Delhi, Lahore, Beijing and Dhaka. In IQAir's 2025 World Air Quality Report, Delhi, Dhaka and Lahore were the world's three most polluted major cities. If you talk in numbers, Delhi averaged 99.6 in 2025, down from 108.3 in 2024 and 102.1 in 2023.
On the other hand, Lahore averaged 88.9, down from 102.1 in 2024. Dhaka averaged 68, down from 78 in 2024 and 80.2 in 2023. While the trend is encouraging, the annual guideline for PM2.5 is just 4, which makes Delhi's average 20 times higher. But why are these cities topping the list?
You can't entirely blame residents in these cities, as they are big, fast-growing centres where many emission sources meet weather that holds pollution in. IQAir found that only 14 percent of the cities in its report met the WHO annual guideline in 2025, compared with 17 percent in 2024.
The health toll is large: outdoor pollution was estimated to cause 4.2 million premature deaths worldwide in 2019, and when household air pollution is added, the figure rises to 6.7 million deaths per year. Around 68 percent of the outdoor deaths were due to heart disease and stroke, 14 percent to COPD, 14 percent to lung infections and 4 percent to lung cancer.
Also read || Can We Stop NAFLD? The RPN11 Fat Switch Explained
What You Can Do Today
The data signifies the importance of a good AQI, and it is most useful when it changes what you do. On any bad day, the goal is to survive and breathe less polluted air, especially when you're already under pressure.
- Check before you go. Use a trusted local source, and look at the forecast as well as the current reading.
- Adjust your exercise. On Poor days, cut back on long or intense outdoor activity. On Very Poor or Severe days, skip unnecessary time outside. Hard exercise makes you inhale more air, and more pollutants.
- Choose your timing and route. It's always better to exercise indoors, pick quieter streets or move your activity to a cleaner time of day.
- Care for indoor air. During major outdoor pollution, keep your windows closed, but ventilate when cooking smoke is the problem. Avoid smoking indoors, and go easy on candles, incense, and burning waste.
- Use masks wisely. If you're in Delhi, Mumbai or any major polluted city, use a snug-fitting respirator mask to reduce the particles you inhale, but that does not replace avoiding exposure.
- Protect the vulnerable. Protect people with asthma, and keep their reliever inhalers within reach. For older adults and children, try avoiding outdoor activity as much as you can and seek urgent care for any chest pain, breathlessness, fainting or other symptoms that don't improve.
As a responsible civilian, you can reduce pollution by walking, cycling, carpooling, or using public transport, maintaining your vehicle, and avoiding waste burning. Cities carry the major share of the blame, and WHO points to cleaner transport, energy-efficient homes, cleaner power and better industry practices.
Like safe water and reliable healthcare, clean air should also be part of shared infrastructure that everyone depends on. While AQI is the first step in acknowledging the pollution, it is helpful in building the conditions required for business. The next step for every government should not be data centers or factories, but also acknowledging where we are going.